What Is Ground Water? 
Ground water is the water that fills cracks and other openings in beds of rocks and sand. Each drop of rain that soaks into the soils moves downward to the water table. The water table is the level below which all geological materials are saturated with water. Ground water is found in the pores and fractures within the subsurface rocks that make up our planet.
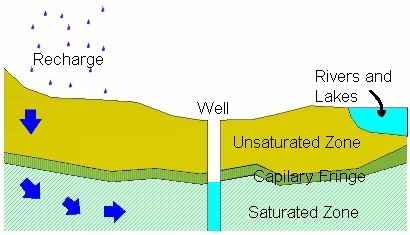
Ground water is a renewable resource. That is, water removed from the ground by pumping is continually replaced. In arid and semi-arid regions, the low rate of replenishment may be exceeded by the rate of ground-water pumping. This results in a condition known as ground-water mining. Adequate time is needed to allow replenishment of underlying ground-water reservoirs (aquifers). The following diagram provides some of the terminology that ground-water hydrologists use.
How Much Do We
Use Ground Water? ![]()
Of the total 408,000 billion gallons of water the United States uses each day, about 80,600 billion gallons, or 19.8 percent is ground water.
What About Rivers,
Streams and Lakes? ![]()
Ground water and surface water are usually hydraulically connected. Ground water provides water to streams rivers and lakes through a process called "base flow." Many lakes and streams are "windows" to the water table.
How Do You Get
At Ground Water? ![]()
Ground water is tapped by wells drilled into water-bearing soils and rocks beneath the surface of the earth. The drilling of water wells is an ancient practice. The ancient Chinese, Persians and Arabs drilled wells. The word "artesian" comes from a free flowing well drilled in the village of Artois in the Paris Basin of France in the 11th Century.
How Do You Find
Ground Water ? ![]()
Ground water is found almost everywhere. That is why "dowsers" are usually successful in finding water. Homeowners who use dowsers swear by them because there is usually enough ground water to meet the needs of a home. Well drillers also are very familiar with the occurrence of ground water in the areas in which they work and commonly drill satisfactory wells.
Where high capacity wells are needed for irrigation, municipal, industrial or other purposes professional ground-water geologists and hydrologists are called on to locate the best well sites. At least one proprietary geophysical method used worldwide by American Ground Water Consultants of Albuquerque, New Mexico has been used to locate high capacity wells in alluvium-filled basins and areas of limestone terrane. Their Thermonic method has also been used to track ground-water contamination and the pathways of ground-water flow through large earthen dams.
Other geophysical, photogeological and satellite imagery methods may also apply. One particularly rapid, and inexpensive professional method involves the identification of fractures traces or lineaments on aerial photography. The photography is generally widely available worldwide from government agencies. When the fracture trace or lineament is identified on the ground, the well is drilled on it.
The successful ground-water exploration program usually involves the integration of a number of methods.
What About
Dowsers or Waterwitches? ![]()
Dowsers have gained a mystique throughout history and I have learned never to argue with a client who believes in dowsers. And, I myself have heard some convincing stories. Let my share with you the experience of the Advanced Research Projects Agency of the Department of Defense (DARPA). DARPA is the same agency that developed the Internet.
DARPA was asked to identify methods to locate water supplies in desert terrane to supply rapidly advancing military forces such as the Coalition troops in Operation Desert Storm. The object of the study was not to locate the best locations but any location that water could be found.
DARPA brought in dowsers from throughout the United States and housed them in hotels. One by one they were taken to a large plot of arid land and they did their dowsing. Their locations were surveyed and no evidence of the location was left on the land. When all was said and done, a map of the locations was plotted. It looked like a pin cushion. After sophisticated statistical analysis, there was no clear site identified. You decide.
How Much Water
Is Underground? ![]()
About 90 percent of our fresh water supplies are underground. Ground water is a significant water supply source that dwarfs our present surface water supply. Ground water is 20 to 30 times more abundant than the volume in all the lakes, streams, and rivers of the United States. More than 15 million water wells supply the United States with 79.4 billion gallons of fresh ground water each day for public and private domestic use, irrigation, livestock, manufacturing, mining, thermoelectric power, and other purposes.
Who In The World
Uses Groundwater? ![]()
The U.S. is the largest water well market in the world. The list gives the approximate number of wells in some countries.
United States - 15 million India - 12.3 million Germany - 500,000 South Africa - 500,000 Taiwan - 37,100 Mongolia - 27,000 Botswana - 7,500 Costa Rica - 5,000
How Do We Use
Ground Water Resources
in the U.S.? ![]()
53 percent of the U.S. population depends on ground water for drinking water. There are 282,828 public water supply wells in the United States. These are wells for public distribution systems. There are 15.1 million individual households served by private wells. Approximately 800,000 water wells are drilled in the U.S. annually by more than 19,000 drilling rigs operated by an estimated 8,000 water-well drilling companies. Private household wells constitute the largest share of all water wells in the U.S.; other kinds of wells are used for municipal systems, industry, agriculture, and quality monitoring. Irrigation accounts for the largest use of ground water in the U.S. The 60 billion gallons of ground water used daily for irrigation is enough water to flood 288 square miles, roughly the area of Memphis, Tennessee, to a depth of 1 foot. California pumps 14.6 billion gallons per day of ground water for all purposes, nearly twice as much as the second-ranked state - Idaho.
Michigan, with 1,121,075 households served by private water wells, is the largest state market, followed by:
Pennsylvania - 978,202 North Carolina - 912,113 New York - 824,342 Florida - 794,557
California leads the nation in the number of irrigation wells with 71,554. Other leading irrigation well states are:
Texas - 57,881 Nebraska - 57,369 Arkansas - 32,555 Kansas - 19,213 Florida - 18,993
The total number of wells in place in the United States, per category listed below is 15,767,673. Not listed are the 181 household wells in the District of Columbia. Fresh ground-water withdrawals are given below.
| Fresh Ground Water Withdrawals by End Use 1980 - 1985 - 1990 Millions of Gallons per Day | |||||
| Use | 1980 | 1985 | Percent of Change | 1990 | Percent of Change |
| Public Supply | 12,000 | 14,600 | 21.7 | 15,100 | 3.4 |
| Domestic Supply | 3,300 | 3,250 | -1.5 | 3,260 | 0.3 |
| Commercial | * | 746 | n/a | 908 | 21.7 |
| Irrigation | 60,000 | 45,700 | -23.8 | 51,000 | 11.6 |
| Livestock | 1,200 | 3,020 | 151.7 | 2,690 | -10.9 |
| Industrial | * 3,930 | n/a | 3,950 | 0.5% | |
| Mining | * 1,410 | n/a | 1,210 | -14.2% | |
| Thermoelectric Power | 1,600 | 608 | -62 | 525 | -13.7 |
| Other | 9,900 | 36 | -102.8 | 757 | 7.0 |
| TOTAL | 88,000 | 73,300 | -16.7 | 79,400 | 8.3 |
Irrigation: Most of the data comes from the 1994 Farm Ranch Irrigation Survey, U.S. Bureau of the Census. Other data comes from 1986, 1989 and 1995 Irrigation Surveys conducted by Irrigation Journal magazine based on estimates from state extension agents.
Public Supply: Public water supply data comes from a 1983 analysis of the U.S. EPA data base known as the Public Water Supplier Inventory. Records of 232,952 public water suppliers are stored. Throughout the U.S., including tribal lands and possessions (note that we have listed only the 50 states), there are 215,963 public water supply systems using at least some ground water. 51,173 systems meet EPA's definition of "community" system.
Community Supply: Community systems in the United States are those which have at least 15 connections used by year-round residents or regularly serve at least 25 year-round residents. Other public water supplies can be found at campgrounds, restaurants, motels, schools and RV parks.
Household: From the 1990 U.S. Census of Housing, these figures represent the number of households served by private individual wells. The U.S. National Ground Water Association assumes the number of households is a one to one ratio to the number of wells.
Other Categories Not Inventoried: Water wells for construction, elevators, environmental, fire protection, heating/cooling, industrial/commercial, landscape irrigation, livestock watering, observation, oil/gas exploration water supply, testing and geothermal heating were not inventoried.
Factiods
1 acre-foot (AF) = 325,851 U.S. Gallons = 43,560 cubic feet
1 cubic foot = 7.48 U.S. Gallons = 62.4 pounds (water weight)
1 U.S. Gallon = 8.35 pounds = 231 cubic inches
1 foot hydrostatic pressure = ).433 pounds per square inch
1 Pound per square inch hydrostatic pressure = 2.31 feet of water
1 cubic foot per second (cfs) or second foot (sec-ft) = 448.83 gallons per minute
For 1 hour = 0.992 acre inch = 26,930 U.S. Gallons
For 24 hours = 1.983 AF = 646,272 U.S. Gallons
For 30 days = 59.5 AF
For 1 year = 723.97 AF
1 AF = 1,200 cubic meters
The WaterBankTM Trust (WBT) was created under Section 501(c)(3) if the United States Internal Revenue Code. The WBT was established to accept donations of water rights for the provision of water for in-stream flows to protect endangered species in the nation's rivers. The WBT also accepts donations, grants and other funding. Our experts worldwide are able to value the water rights based on recent commercial transactions. All contributions to the WBT are tax deductible. For donations of water rights or funds from other countries, the WBT can easily establish charitable trusts elsewhere through our worldwide network of attorneys. For further information, please call us at 505-843-7643 in the United States or send us and e-mail