WASTE WATER
USING THE AQUASONICS RAPID SPRAY DESALINATION PROCESS
PREPARED BY
DR. WILLIAM M. TURNER
WESTWATER RESOURCES
610 Gold Avenue, Southwest - Suite 111
Albuquerque, New Mexico 87102
Telephone: 505-843-7643
Telefacsimile: 505-246-2236
Email: wturner@waterbank.com
INTRODUCTION
Rapid Spray Desalination (RSD) is a newly developed technology that makes effective use of waste heat generated from gas-fired electrical generating plants, wastewater treatment plants, landfills, marine engines, and other sources, for desalination or for the recovery of dissolved substances.
RSD, is a recently patented process, whereby water under pressure is nebulized into a moving hot air stream. Because of the extremely high surface area of the water droplets, the water vaporizes instantly and efficiently. By careful control of the system, salt that remains behind is concentrated into a brine for material handling purposes.
APPLICATIONS
The most obvious use of RSD is desalination in coastal and inland locations for production of fresh drinking water. Other potential users are interested in recovering or disposing of the dissolved materials. Others are interested in using the process for reducing the volume of their wastewater.
For example, the pickling industry wishes to recover their pickling salts. The fresh water would be a by-product. The coal bed methane industry produces large volumes of water with high salt content that must be recovered and disposed of before the water can be discharged into rivers. The power industry has large volumes of wastewater from scrubbers and cooling towers that, in the arid Western United States, is typically discharged into large and expensive evaporation ponds. Additionally, many oil producing countries are flaring-off of excess gas that could be used as a heat source for production of fresh water.
The report that follows presents the results of RSD treatment of water that has an initial total dissolved concentration of solutes of 160,000 milligrams per liter or about five times the salinity of sea water.
THE DEMONSTRATION
Five gallons of wastewater was submitted to WestWater Resources for evaluation of the RSD process. The RSD unit used is the original bench unit. The RSD unit does not have sophisticated controls and its functionality should not be considered as highly efficient or typical of that of a fully designed and constructed operating unit. The proof-of-concept RSD unit is still under construction.
The RSD unit used uses a heating element for a heat source across which air is blown into the evaporation chamber. As the heated air moves along the evaporation chamber, nebulized wastewater was injected into the evaporation chamber. The moving vapor and brine droplets pass through a mechanical filter which traps the brine droplets. The pure vapor phase pass on to a condenser. The brine droplets are periodically flushed from the filter with the water being treated.
In the demonstration trial, samples of treated and untreated water were collected for major cation and anion analysis. The samples were submitted to Hall Environmental Testing Laboratories in Albuquerque, New Mexico following chain-of-custody procedures.
The analytical results for the untreated water, treated water, and concentrate are given in the table below. The results are reported in milligrams per liter of water and milliequivalents per liter of water.
[ Milligrams per liter is roughly equivalent to parts per million by weight of solution. That is 79 pounds of calcium is present in one million pounds of water or 79 tons of calcium is present in 79 million tons of water. At higher total dissolved solids, milligrams per liter is more correct because the weight of the other solutes is also included in the solution weight.]
[Millequivalents express the reactive concentration. One mole of a cation such as calcium will combine exactly with one mole of chloride or sulfate. One mole is a gram atomic weight of the solute. For example, calcium has an atomic number or gram atomic weight of 40.08 grams per mole. Because calcium has a valence state of -2, one equivalent will be 20.04 grams. If there are 79 grams per million grams of calcium, there would be 3.94 milliequivalents. That is, 79 divided by 20.04 is 3.94]
SOLUTE | UNTREATED | TREATED | CONCENTRATE | |||
| Calcium | 79 | 3.94 | 1.6 | 0.08 | 20 | 2.00 |
| Magnesium | 490 | 40.32 | 1.7 | 0.14 | 600 | 49.37 |
| Sodium | 25000 | 1087.5 | 160 | 6.96 | 57000 | 2749.50 |
| Potassium | 610 | 15.6 | 1.9 | 0.05 | 1100 | 28.14 |
| Chloride | 5000 | 141.01 | 90 | 2.54 | 8400 | 236.91 |
| Sulfate | 31000 | 645.39 | 150 | 3.12 | 35000 | 174.65 |
| Bicarbonate | 5700 | 93.42 | 20 | 0.33 | 2900 | 47.53 |
| Phosphate | 1200 | 116.28 | 0 | 0 | 35.85 | |
| Carbon Dioxide | 3100 | 103.32 | 0 | 0 | 4900 | 163.31 |
| TDS (Calc) | 72179 | 425.2 | 109920 | |||
| TDS (Analysed) | 130,000 | 440 | 180,000 | |||
| Electrical Conductivity (EC) | 140,000 | 700 | 170000 | |||
| TDS(Calc)/EC | 0.52 | 0.61 | 0.65 | |||
| Total Cations | 1147.37 | 7.23 | 2558.01 | |||
| Total Anions | 983.14 | 5.99 | 1176.40 | |||
| Cation/Anion Balance |
| 1.17 |
| 1.21 | 2.17 | |
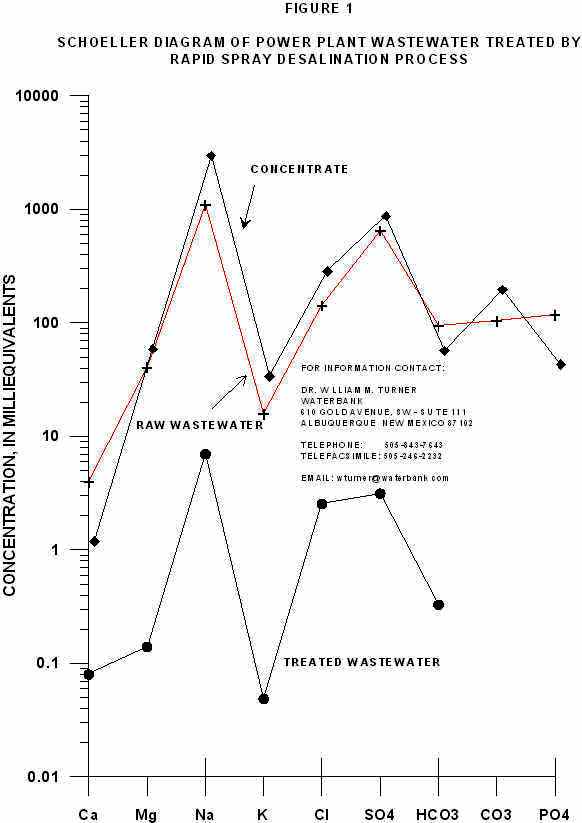
The solute concentrations are plotted as a Schoeller diagram in Figure 1 for the purpose of visualization of the comparative change in the concentration of solutes in the three samples. Another purpose of the Schoeller Diagram is to evaluate visually that the ratios of the solutes to each other are relatively similar. In a Schoeller Diagram similar slope of lines connecting solute concentrations is indicative of water from a similar source. The third purpose of using the Schoeller diagram is to indicate possible errors in the analysis where the cation/anion balance is clearly incorrect and where a calculated TDS/EC ratio is significantly of range.
The range in the ratio of TDS(Calc)/EC for natural water is from 0.55 to 0.96. The ratio is in this range.
The cation/anion balance for the treated wastewater clearly shows that the total anion concentration is slightly low. Examination of the Schoeller Diagram clearly indicates that there is a deficiency in sulfate (an anion) in the analysis. We suspect an error in the analysis with regard to sulfate. An increase in the sulfate concentration of 240 mg/l or 5.01 meq/l will yield a cation anion balance of 1.00 and a total sulfate concentration of 11 meq/l. If 11 meq/l are plotted on the Schoeller Diagram, it is clear that the ratios of all solutes are nearly the same. The resulting TDS(calc)/EC will be 1.07 or 1.
There is an obvious error in the analysis of the concentrate because of the error in the cation-anion balance. Unfortunately, because of the small volue of concentrate recovered, the water could not be re-analysed. The method of analysis used resulted in a high cation concentration.
RESULTS
In the demonstration trial using real wastewater from a power plant evaporation pond, a single pass though the RSD bench unit dropped the total dissolved solid concentration from 130,000 milligrams per liter to 440 milligrams per liter
This is equivalent to 130 grams per 1000 grams or 130 pounds of salt per 1000 pounds of solution to 0.4 grams per 1000 grams of solution or 0.4 pounds of salt per 1000 pounds of solution. The final concentrate had a total dissolved solids concentration of 180,000 milligrams per liter. 1000 pounds of water is about 120 gallons.
The volume of treated water collected totaled 1750 milliliters. The volume of concentrate collected was about 250 milliliters though we believe some was lost in the collection process. To determine the reduction in volume that the RSD process can achieve based on the analytical results, we use the mass balance equation to determine the actual volume processed and the volume of concentrate produced given the volume of treated water produced and the chloride concentrations from the untreated, treated, and concentrated water. The mass balance equation is:
CuVu = CtVt + CcVc
Where:
Cu = concentration of solute in untreated water
Vu = volume of untreated solute
Ct = concentration of solute in treated water
Vt = volume of treated water
Cc = concentration of solute in concentrated water
Vc = volume of concentrated water
Based on an iterative solution, we find that 4,275 milliliters of untreated water with a chloride concentration of 5,000 milligrams per liter produces 1,750 milliliters of treated water with a chloride concentration of 90 milligrams per liter and 2,525 milliliters of concentrate with a chloride content of 8,000 milligrams per liter.
The RSD process in this demonstration reduced the overall volume of wastewater from 4,275 milliliters to 2,525 milliliters or a 59 percent reduction in volume.
CONCLUSIONS
The RSD process, in a single step, produced fresh water in a single pass through the bench unit. A 59 percent reduction in the wastewater was achieved.
We believe that a properly functioning and well engineered RSD unit will lead to greater efficiency and greater production of good quality water and wastewater volume reduction.
FOR FURTHER INFORMATION CONTACT: wturner@waterbank.com